

The crypto market is experiencing a pullback after Bitcoin, the leading cryptocurrency, reached a new all-time high. However, Ethereum (ETH) is not left out in this downward move.
After setting a new yearly high of $4,094, the price of Ethereum has been moving downward and this has led to the price trading below the 100-day Moving Average (MA) both in the 1-hour and 4-hour timeframes, but this is not so in the daily timeframe.
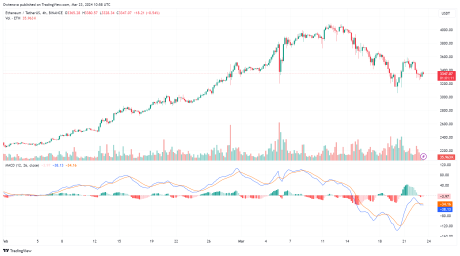
Will the price continue downward or will it change direction and start moving upward? At the time of writing, Ethereum’s price was trading around $3,360 and was up by 0.64% in the last 24 hours.
Ethereum Indicators And What They Suggest
Looking at the chart, technically we can see that a support level of $3,067 and a resistance level of $3,681 and $3,591 have been formed respectively. Nonetheless, there could be more support and resistance created if the price continues to move downward.
4-Hour Moving Average: A technical observation of the chart from the 4-hour timeframe as seen in the image below reveals that the price is trending below the 100-day moving average. This suggests that the price is on a downtrend and could potentially move further downward.
4-Hour RSI indicator: With the help of the Relative Strength Index indicator (RSI) we can see the RSI signal line is trending below the 50 line. This is a strong indication that the price of Ethereum is in a downward trend as observed in the image above.
MACD Indicator: Taking a close look at the MACD indicator in the 4-hour timeframe, it appears that the MACD histogram has dropped below the zero line. In addition, both the MACD line and the signal line have crossed below the zero line.
This setup indicates that the price is still bearish and there are possibilities that it could still move downward. The image below provides more details:
Possible Outcome
If the price of Ethereum continues downward and breaks below the support level of $3,067, it could move further downward to create a new support level. However, if the price fails to break below this support level, we could see a price reversal and may start a fresh trend upward. Thus there could be a possibility that the price could break above the resistance levels of $3,681 and $3,591 respectively, and continue its bullish run.
Featured image from iStock, chart from Tradingview.com
Disclaimer: The article is provided for educational purposes only. It does not represent the opinions of NewsBTC on whether to buy, sell or hold any investments and naturally investing carries risks. You are advised to conduct your own research before making any investment decisions. Use information provided on this website entirely at your own risk.

